
PATENT ASSET VALUATION APPRAISAL
AND EVIDENTIARY MEMORANDUM
SYSTEM AND METHOD FOR DISTRIBUTING
IMPERATIVE SERVICES AND PRODUCTS
U.S. Patent No. 10,438,307 B2
Application No. 15/817,191
Publication US 2018/0108098 A1
Inventor and Original Applicant: Brett P. Phillips
INDICATED PATENT ASSET VALUE — BASE CASE: $1,109,617,706
Rounded Indication: NOT LESS THAN $1.1 BILLION
Valuation Premise: 100% interest in the subject patent/invention, as-if in force or validly reinstated, subject to ownership/title verification and the assumptions stated herein.
Valuation / Research Date: September 17, 2026
APPRAISAL PURPOSE AND LIMITATION. This memorandum is written in patent-appraisal form for counsel and judicial review. It expresses an indicated asset value under stated assumptions and a stated hypothetical condition concerning enforceability. It is not a signed report by a separately retained ASA/CVA/CPA valuation professional, and the independent appraisers cited below have not been retained to appraise this specific patent. Their published credentials and methodologies are used as independent methodological corroboration. A court filing should attach current USPTO status/ownership records and, where required, a signed expert report adopting or revising the assumptions.
Contents
- I. Appraiser’s Executive Conclusion
- II. Appraisal Assignment, Asset, Standard and Premise of Value
- III. Patent Identity, Inventorship, Presumptive Ownership and Physical Grant Evidence
- IV. Material USPTO Status Condition
- V. Page-by-Page Review of US 2018/0108098 A1
- VI. Figures 1–5: Technical and Commercial Architecture
- VII. Patent Disclosure: Imperative Services, Buying Power and Monetization
- VIII. Claims and System Architecture Cross-Reference
- IX. Independent Patent-Appraisal Experts and Methodological Corroboration
- X. Independent U.S. Market Evidence
- XI. Independent Buying-Power and Deregulation Evidence
- XII. Global Commercial Opportunity — Not Required to Reach Base-Case Value
- XIII. Property-Technology / Utility-Management Sector Scale
- XIV. Patent Valuation Methodologies Applied
- XV. Base-Case Indicated Patent Asset Value: $1.1096 Billion
- XVI. DCF Sensitivity and Required Cash-Flow Thresholds
- XVII. Relief-from-Royalty / Transaction-Volume Cross-Checks
- XVIII. Residential, Multifamily and Commercial Unit-Economics Cross-Checks
- XIX. Risk Factors and Evidence Required for Final Court Opinion
- XX. Proposed Findings Language for Counsel / Valuation Expert
- XXI. Conclusion
- Appendix A. Patent-to-Evidence Cross-Reference Matrix
- Appendix B. Source Authorities and Clean Links
- Appendix C. Exhibit Index and Calculation Notes
I. Appraiser’s Executive Conclusion
Subject asset. The subject is U.S. Patent No. 10,438,307 B2 and the invention disclosed in Publication US 2018/0108098 A1, “System and Method for Distributing Imperative Services and Products,” invented and originally applied for by Brett P. Phillips. [S1][S2]
Indicated value conclusion under the stated base case. Under the hypothetical condition that the patent is in force or validly reinstated, that a 100% ownership interest is vested in Brett P. Phillips, and that the base-case adoption and net-cash-flow assumptions stated in Section XV are achieved, the indicated patent asset value is $1,109,617,706, rounded to not less than $1.1 billion.
| BASE-CASE PATENT ASSET VALUE = $1,109,617,706 Rounded indication: NOT LESS THAN $1.1 BILLION |
This is an asset-value conclusion, not a market-size conclusion. The surrounding utility, communications, payment and property markets are used only to test whether the modeled adoption and transaction assumptions are proportionate to real markets. The patent asset value itself is calculated from patent-attributable net cash flow discounted to present value, and is cross-checked using transaction-yield, unit-economics, and market-scale analyses. [S8][S9][S14][S20]
Base-case cash-flow bridge. The model uses only two U.S. endpoint groups: (1) 10% of the 28,579,477 U.S. housing units in buildings with 5 or more units, at $5.00 per active unit per month in net patent-attributable cash flow; and (2) 10% of approximately 5.9 million U.S. commercial buildings, at $12.00 per active building per month. Those two streams total $256,436,862 per year. Discounted for 11 years at 20%, the present value is $1,109,617,706. [S24][S27]
Conservatism / excluded upside. The base case assigns no separate incremental value to single-family housing, governmental properties, global property markets, high-speed Internet households, natural-gas consumers, wireless/cellular users, security, telephone, television, merchant services, payment processing, or additional provider categories expressly identified by the patent. Those categories are therefore not required to reach the $1.1 billion base-case indication. [S1][S25][S26][S32][S33][S34]
II. Appraisal Assignment, Asset, Standard and Premise of Value
Property interest. 35 U.S.C. § 261 provides that patents have the attributes of personal property. USPTO guidance explains that patent ownership carries the right to exclude others from making, using, offering for sale, selling or importing the claimed invention, subject to law and the patent’s status. [S3][S4]
Standard of value. For this memorandum, “fair market value” is used in the conventional willing-buyer / willing-seller sense: the price at which property would change hands when both sides are informed and neither is compelled to transact. [S11]
Premise and hypothetical condition. The primary $1.1+ billion indication values a 100% interest in the patent as a licensable/commercializable patent asset, under the hypothetical condition that the patent is in force or validly reinstated and that ownership/title is established. The legal-status issue is separately disclosed in Section IV and is not concealed or ignored.
Personal wealth is not a valuation input. The owner’s personal net worth does not increase or decrease the fair market value of the patent. If a person owns 100% of an asset worth $1.1 billion, that asset represents $1.1 billion of gross asset value before liabilities, taxes, liquidity considerations and other personal-balance-sheet items; this memorandum does not independently appraise the owner’s personal net worth.
III. Patent Identity, Inventorship, Presumptive Ownership and Physical Grant Evidence
Official identity. The supplied patent publication identifies Brett P. Phillips as both applicant and inventor, Application No. 15/817,191, filed Nov. 20, 2017. The corresponding grant is U.S. Patent No. 10,438,307 B2, issued Oct. 8, 2019. [S1][S2]
Presumptive ownership basis. USPTO guidance states that, for original applications filed on or after Sept. 16, 2012, the original applicant is presumed to be the owner unless there is an assignment. Because the subject publication identifies Brett P. Phillips as applicant, the record supports presumptive original ownership, subject to any later written assignment. A certified Assignment Center chain-of-title search should be attached for final court proof. [S3][S4]
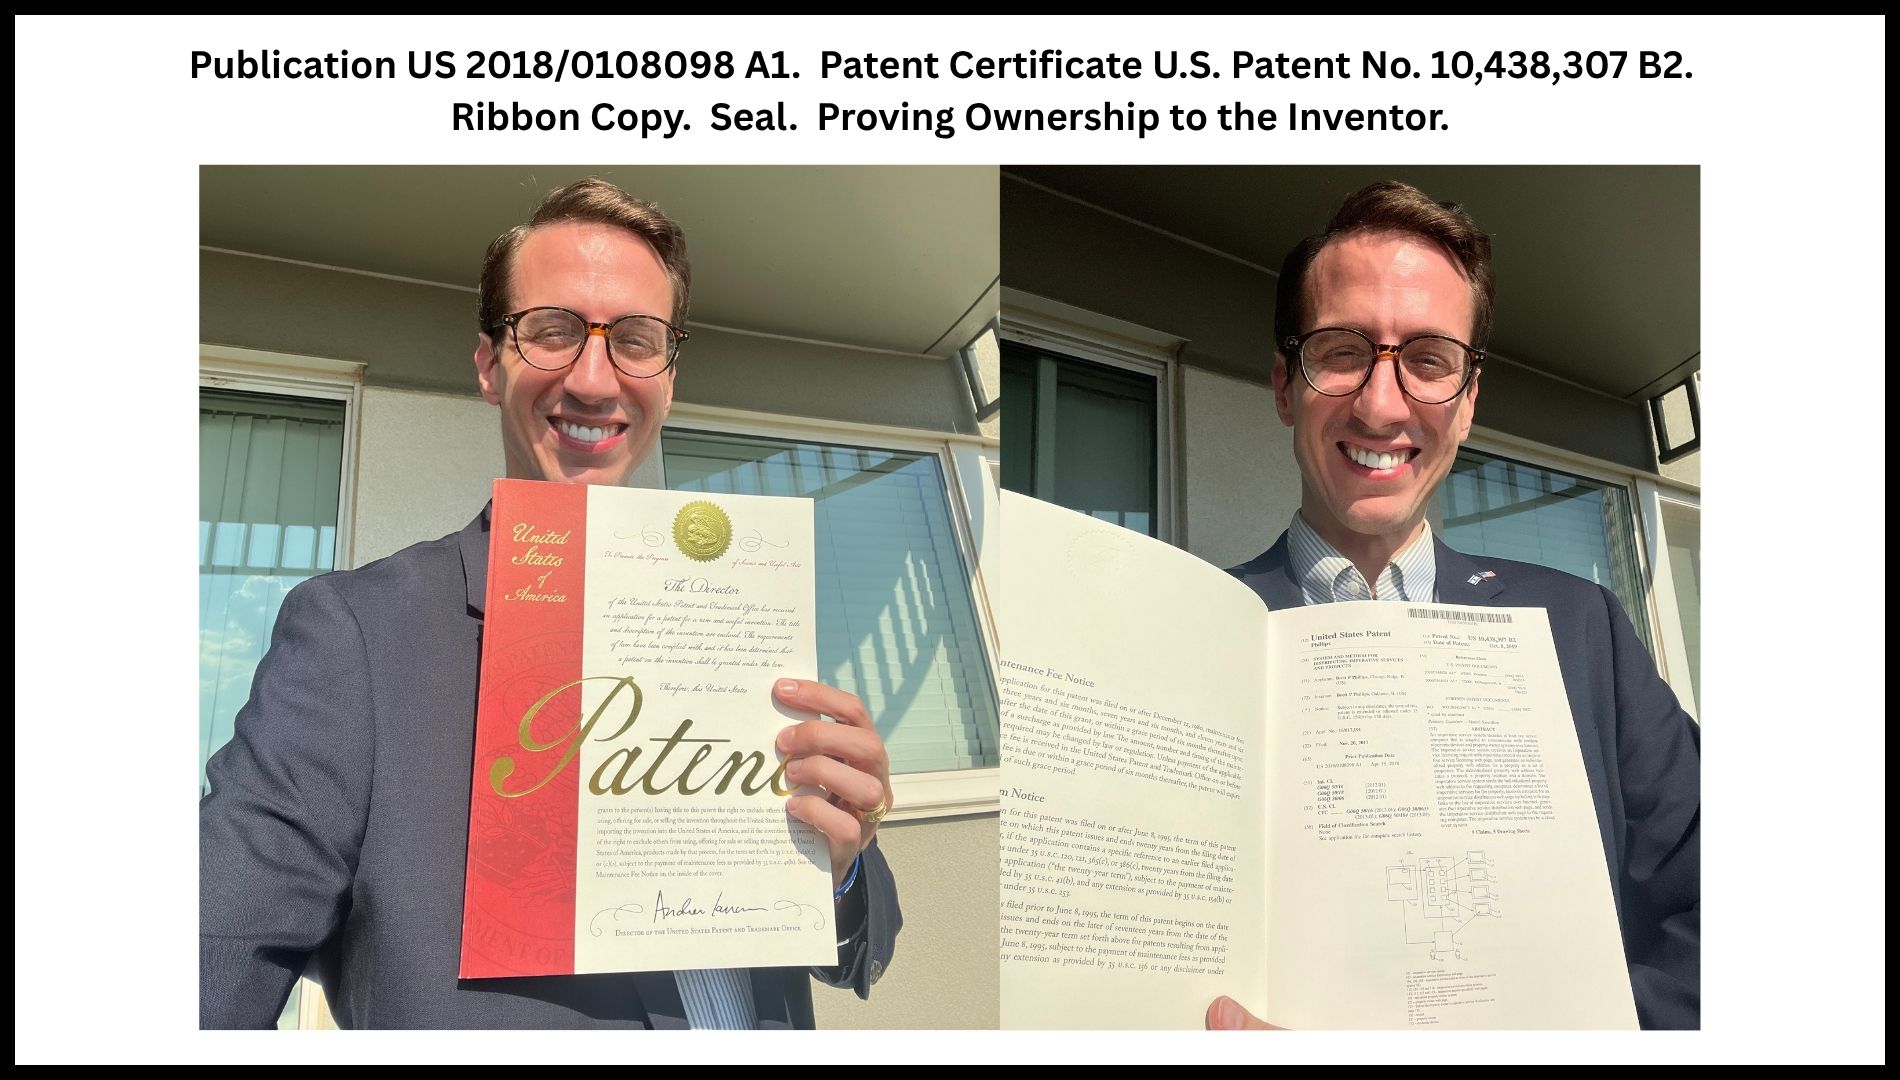
Physical grant evidence. The owner supplied photographs of the USPTO ribbon/seal grant materials and the issued patent front page. The owner represents that these photographs depict the original grant received from the USPTO. The images corroborate the patent number, title, application number, inventor name and Oct. 8, 2019 patent date; physical possession is corroborative evidence but is not a substitute for an official chain-of-title record.
Exhibit A-1 — Owner-supplied photograph of the USPTO patent grant presentation/ribbon copy. The owner represents that this is the original grant received from the USPTO.
Exhibit A-2 — Owner-supplied photograph of the issued patent front page showing U.S. Patent No. 10,438,307 B2, Application No. 15/817,191, inventor Brett P. Phillips, and Oct. 8, 2019 patent date.
IV. Material USPTO Status Condition
Current public-status issue. The USPTO Official Gazette lists Patent 10,438,307 / Application 15/817,191 among patents that expired Oct. 8, 2023 for failure to pay maintenance fees. Google Patents likewise presently displays “Expired – Fee Related.” [S2][S5]
Reinstatement mechanism. USPTO MPEP § 2590 provides a petition path for acceptance of delayed maintenance-fee payment where the delay is shown to have been unintentional, subject to applicable requirements and intervening-rights rules. [S6]
Appraisal treatment. The $1.1+ billion conclusion in this memorandum is therefore an “as-if in force / validly reinstated” patent asset valuation. A final signed appraisal should state separately any value conclusion for the patent in its current as-is legal status if reinstatement has not occurred. This treatment is materially stronger for judicial review than omitting an adverse status fact.
V. Page-by-Page Review of US 2018/0108098 A1
| PDF Page | Patent Section | Appraisal-Relevant Evidence |
|---|---|---|
| 1 of 11 | Cover / Abstract | Identifies title, applicant/inventor, Application 15/817,191 and publication data. Abstract describes property-specific web addresses, provider links, licensing and financial-benefit allocation. |
| 2 of 11 | Sheet 1 / FIG. 1 | System 102; distribution page 103; service links 104/106/108; provider systems/pages 112–119; property-owner system 120; owner page 122; link 123; tenant 130; property owner 131; device 132. |
| 3 of 11 | Sheet 2 / FIG. 2 | Internet topology connects owner system, imperative-service system, provider systems/databases and electronic device; supports remote/network scalability. |
| 4 of 11 | Sheet 3 / FIG. 3 | Licensing fields: website 302; number of properties 304; number of occupants 306; property address 308; phone 310; email 312; intended goal 314; License Now 316. |
| 5 of 11 | Sheet 4 / FIG. 4 | Workflow 402–420: request/respond license page; receive/validate request; generate unique property address; determine providers; send URL; generate/return distribution page. |
| 6 of 11 | Sheet 5 / FIG. 5 | Payment allocation 502–506: retrieve provider payment amount; allocate predetermined portion for property owner; allocate predetermined portion for Internet distribution service provider. |
| 7 of 11 | Specification p.1 | Field/background/objects; lists electricity, renewable electricity, natural gas, security, energy automation, merchant services, payment processing, telephone, television, cellular network and high-speed Internet; identifies buying-power problem and owner/resident benefits. |
| 8 of 11 | Specification p.2 | Summary and drawing descriptions; property-specific Internet address, linked provider pages, licensing page and benefit distribution. |
| 9 of 11 | Specification p.3 | Detailed transaction flow; provider recognizes transaction source; provider gives financial benefit; system allocates benefit; states lower living cost, lower owner operating expense, increased owner revenue. |
| 10 of 11 | Specification p.4 / Claims begin | FIG. 4 workflow; ¶[0033] payment benefit; ¶[0034] illustrative 70%/30% allocation; claim 1 begins server/network/software/license process. |
| 11 of 11 | Claims continuation | Claim 1 and dependent claims address individualized property URL, service-provider list, web page delivery, licensing, source identifiers and cloud implementation. |
VI. Figures 1–5: Technical and Commercial Architecture
FIG. 1 — Core distribution architecture connecting imperative-service system, property owner, tenant/electronic device, provider systems and provider web pages.
FIG. 2 — Internet/network topology connecting the system, property owner, provider systems/databases and user device.
FIG. 3 — Property-owner licensing interface: website, number of properties, occupants, address, phone, email, intended goal and “License Now.”
FIG. 4 — License request/validation, unique property web address, applicable-provider determination and distribution-page delivery.
FIG. 5 — Provider-payment retrieval and predetermined allocation to property owner and Internet distribution service provider.
VII. Patent Disclosure: Imperative Services, Buying Power and Monetization
Recurring imperative services. Paragraph [0003] expressly identifies electricity, renewable electricity, natural gas, security, energy automation, merchant services, payment processing, telephone systems, television, cellular-phone-network services and high-speed Internet. [S1]
Buying-power problem addressed. The background states that residents traditionally acquire services individually without quantitatively leveraging their buying power together; it further states that owners are not participating as advocates in the resident’s transaction and that residents may fail to obtain optimal value without leveraged quantitative buying power. [S1]
Owner and occupant value proposition. The patent states that the system can allow property owners to increase revenue without increasing rent/common-area/rent-related fees, while reducing resident cost and property operating expense and improving net profit/economic output per square foot. [S1]
Transaction-linked monetization. The detailed description states that a provider recognizes a transaction generated through the imperative-service system and can provide a financial benefit, such as a percentage or portion of a service-fee transaction, to the system provider. The system then allocates portions of that benefit. [S1]
Illustrative 70/30 allocation. Paragraph [0034] gives an example in which 70% of the benefit is allocated for the property owner and 30% for the provider of the imperative-service system. These percentages are illustrative terms in the patent, not evidence that a third-party provider has contracted to pay those percentages. [S1]
VIII. Claims and System Architecture Cross-Reference
| Technical / Commercial Element | Patent Cross-Reference | Valuation Relevance |
|---|---|---|
| Server + network + software | Claim 1; ¶¶[0012]–[0021] | Supports implementable software/server architecture rather than a mere business slogan. |
| License page / request / validation | Claim 1; FIGS. 3–4 | Repeatable property-owner licensing/onboarding workflow. |
| Individual property web address | Claim 1; FIG. 4 step 410; ¶[0020] | Property-specific digital distribution endpoint. |
| Applicable provider determination | Claim 1; FIG. 4 step 412 | Links each property to available providers. |
| Distribution page with provider links | Claim 1; FIG. 4 steps 416–420 | Customer-facing marketplace/distribution interface. |
| Internet delivery / device access | Claim 1; FIGS. 1–2 | Remote deployment/scalability. |
| Cloud implementation | Claim 9 | Modern hosted implementation. |
| Provider financial benefit | ¶¶[0024]–[0025], [0033]–[0034]; FIG. 5 | Direct patent disclosure of monetization/payment allocation. |
IX. Independent Patent-Appraisal Experts and Methodological Corroboration
Purpose of this section. The following independent appraisers/valuation experts are cited because their public credentials and published methodologies corroborate the valuation framework used here. None is represented as having reviewed or appraised this specific patent unless separately retained. The subject $1.1+ billion conclusion remains the conclusion of this memorandum under its stated assumptions, not an opinion attributed to these external professionals.
| Independent Appraiser / Expert | Credentials / Practice | Published Valuation Principle Relevant Here |
|---|---|---|
| Gregory Campanella, CLP — Ocean Tomo / J.S. Held | Senior Managing Director; IP valuation, licensing, transactions and litigation support; technology experience includes telecom, software, wireless and e-commerce. [S13] | Ocean Tomo performs patent appraisals for inventors and litigation/transaction purposes and emphasizes market-based scenario analysis and patent-specific valuation. [S12][S13] |
| Brent Sloan, ASA — Stout | Accredited Senior Appraiser; Intellectual Property / Intangible Assets Valuation; technology valuation. [S15] | Stout’s patent-valuation guidance says cost, market and income approaches should be considered, with weight based on reliability, purpose and valuation date; multiple approaches are preferred where possible. [S14][S15] |
| Peter Wilhelm, CVA — Gordon Brothers | Senior Director, Global Valuations; manages IP appraisals; specializes in brands and patents; USPAP compliant. [S16] | Hilco/Gordon market practice supports defensible IP appraisals using market evidence and income/relief-from-royalty methods, with risk-adjusted discount rates and transaction/license data. [S16][S17] |
| Jeff Anderson — CONSOR | Managing Director; IP valuation expert; designated/testifying expert in patent and other IP matters in domestic and international courts. [S19] | CONSOR identifies patent value drivers including novelty, breadth/depth, competition, commercialization, protectability, market size and future prospects — all analyzed in this memorandum. [S18][S19] |
| J. Timothy Cromley — valuation professional and patent attorney | Journal of Accountancy identifies him as Accredited Senior Appraiser, professional engineer and registered U.S. patent attorney. [S20] | His patent-pricing framework uses profit contribution/royalty methods, DCF, with-and-without analysis, risk-adjusted discounting and complete reporting of assumptions/limitations. [S20] |
Appraisal synthesis. The subject valuation applies the same recognized families of methods: income/DCF as the primary method, relief-from-royalty or transaction-yield as a cross-check, with-and-without/unit-economics reasoning, and market/sector evidence as a reasonableness check. [S8][S9][S14][S17][S20][S21]
X. Independent U.S. Market Evidence
| Patent-Named / Related Market | Independent Scale Evidence | Source |
|---|---|---|
| Electricity | $553.285B 2025 revenue to ultimate customers; $262.079B residential; $200.316B commercial. | EIA [S22] |
| Natural gas | 73.7M residential + 5.66M commercial consumers in 2024. | EIA [S26] |
| Internet / broadband | 123.87M U.S. households with Internet subscription in 2024. | Census [S25] |
| Occupied housing endpoints | 132.74M occupied U.S. housing units in 2024. | Census [S23] |
| Multifamily endpoints | 28.58M units in structures with 5+ units in 2024. | Census [S24] |
| Commercial real estate | Approx. 5.9M U.S. commercial buildings. | EIA CBECS [S27] |
| Merchant services / payment processing | $140.01T 2024 noncash-payment value; $11.50T card-payment value. | Federal Reserve [S32] |
Appraisal implication. These figures are not multiplied by a royalty rate and called “value.” They establish that the patent addresses recurring service categories and endpoint populations large enough that a relatively small adoption fraction and modest per-property cash flow can generate the cash flow necessary to support a billion-dollar patent asset value.
XI. Independent Buying-Power and Deregulation Evidence
EPA aggregation evidence. EPA explains that Community Choice Aggregation combines customer demand and states that some CCA programs have obtained electricity prices 15%–20% below residential retail prices due to collective buying power and market conditions. This does not guarantee equivalent savings under the subject patent; it independently corroborates the economic mechanism that aggregation can create price leverage. [S30]
DOE procurement evidence. DOE FEMP states that entities can aggregate requirements to obtain competitive pricing in retail-choice markets. [S31]
Deregulation / supplier choice. EIA confirms that some electricity customers can choose alternate suppliers in restructured states, and that natural-gas customer-choice programs operate in multiple states and D.C. These conditions increase the number of environments in which a property-specific provider-distribution platform can offer comparison, procurement, referral or revenue-sharing value. [S28][S29]
XII. Global Commercial Opportunity — Not Required to Reach Base-Case Value
Global scale. ITU reports approximately 6 billion Internet users and approximately 9.2 billion mobile-cellular subscriptions worldwide; IEA data establish global electricity and natural-gas demand at enormous scale. [S33]–[S36]
Territorial limit. A U.S. patent does not itself create worldwide exclusion rights. Global market evidence is therefore treated only as evidence of technical/commercial scalability and potential voluntary licensing or related rights, not as a claim that U.S. Patent No. 10,438,307 excludes competitors worldwide.
Conservative base case. The $1.1096 billion base-case calculation in Section XV uses only U.S. multifamily and U.S. commercial-building endpoints. It does not require any global revenue. Global commercialization is therefore upside, not a necessary input to the base-case indicated value.
XIII. Property-Technology / Utility-Management Sector Scale
RealPage transaction context. An SEC-filed announcement reports that Thoma Bravo completed the acquisition of RealPage in 2021 at approximately $10.2 billion including net debt. RealPage is an operating company, not a patent comparable, so the enterprise price is not directly applied to the subject patent. It demonstrates, however, that property-technology platforms tied to multifamily operations can support multi-billion-dollar enterprise values. [S37]
Scale of endpoint deployment. RealPage currently states that it serves more than 24 million rental units worldwide, and it markets resident utility billing, utility expense management, submetering, energy procurement and NOI enhancement. The subject base case requires 2.858 million active U.S. multifamily units — about 11.9% of RealPage’s stated 24 million-unit global reach — as a scale comparison, not a claim that the subject patent has RealPage’s customers. [S38][S39]
Market-approach limitation. Because RealPage includes numerous products, customers, employees, liabilities, brands, contracts and goodwill, its transaction value is only sector context. A true market approach would require comparable patent/license transactions and adjustments for claim scope, remaining life, geography, legal status, cash flows and risk. [S14][S18]
XIV. Patent Valuation Methodologies Applied
- Income / discounted cash flow (primary). Patent-attributable future net cash flows are discounted to present value. This is consistent with WIPO, Stout, Ocean Tomo and patent-appraisal literature. [S8][S9][S12][S14][S20]
- Relief-from-royalty / transaction-yield cross-check. The model tests what annual transaction base would be needed at specified net IP yields. Relief-from-royalty is a widely used income method for intangible assets, but a final signed appraisal should derive the actual royalty/take rate from comparable licenses or provider contracts rather than assume a rate. [S17][S20][S21]
- With-and-without / incremental benefit cross-check. The patent’s own disclosure identifies cost reductions and incremental property-owner/system-provider benefits. A with-and-without analysis values the difference between expected cash flows with use of the patented system and without it. [S20]
- Market / sector cross-check. Comparable patent transactions are preferred when sufficiently similar data exist. Sector enterprise transactions and platform scale are used here only to test plausibility, not as direct patent comparables. [S14][S18][S37]
Core DCF formula. For level annual patent-attributable net cash flow: PV = CF × [1 − (1+r)^−n] / r. Here, r = 20% and n = 11 years. The 20% rate is intended to reflect substantial technology, adoption, legal and commercialization risk; a retained appraiser should independently select the final rate.
XV. Base-Case Indicated Patent Asset Value: $1.1096 Billion
Base-case assumptions. The model is intentionally simple, transparent and U.S.-only. It assumes 10% penetration of the U.S. 5+ unit multifamily stock and 10% penetration of U.S. commercial buildings. Net patent-attributable monthly cash flow is $5.00 per active multifamily unit and $12.00 per active commercial building. These amounts may be produced by provider payments, licensing charges, transaction shares or a combination, but they are net amounts attributable to the patent after modeled operating costs for purposes of this appraisal.
| Base-Case Component | Endpoint Count | Adoption | Net Patent Cash Flow | Annual Patent Cash Flow |
|---|---|---|---|---|
| U.S. 5+ unit multifamily | 28,579,477 units | 10.0% | $5.00 / active unit / month | $171,476,862 |
| U.S. commercial buildings | 5,900,000 buildings | 10.0% | $12.00 / active building / month | $84,960,000 |
| TOTAL | $256,436,862 |
Present-value calculation. At a 20% discount rate for 11 years, the annuity present-value factor is 4.327060. Therefore: $256,436,862 × 4.327060 = $1,109,617,706. Rounded, the indicated base-case patent asset value is not less than $1.1 billion.
| $256,436,862 annual net patent-attributable cash flow × 4.327060 present-value factor (20%, 11 years) = $1,109,617,706 INDICATED PATENT ASSET VALUE |
FIG. 5 allocation reasonableness cross-check. If the patent’s illustrative 30% system-provider share were applied, the $5.00 multifamily system share corresponds to a total provider-funded benefit of approximately $16.67 per unit per month, of which about $11.67 would be allocated to the property owner under the illustrative 70/30 split. The $12.00 commercial system share corresponds to about $40.00 total monthly provider-funded benefit per building, with about $28.00 allocated to the property owner. These are arithmetic cross-checks, not contractual promises. [S1]
Why the model does not double-count total-addressable-market value. The model does not capitalize the entire electricity, gas, Internet, wireless or payments markets. It uses only endpoint counts and modest net cash flow per active property. It assigns no separate revenue to multiple other patent-named service categories. The surrounding market data are therefore reasonableness evidence rather than the mathematical source of the $1.1096 billion conclusion.
XVI. DCF Sensitivity and Required Cash-Flow Thresholds
| Discount Rate | 11-Year PV Factor | Annual Net Patent CF Needed for $1.1B | Monthly Equivalent |
|---|---|---|---|
| 10% | 6.4951 | $169,359,456 | $14,113,288 |
| 12% | 5.9377 | $185,256,945 | $15,438,079 |
| 15% | 5.2337 | $210,175,881 | $17,514,657 |
| 18% | 4.6560 | $236,254,025 | $19,687,835 |
| 20% | 4.3271 | $254,214,174 | $21,184,514 |
| 22% | 4.0354 | $272,587,803 | $22,715,650 |
| 25% | 3.6564 | $300,842,143 | $25,070,179 |
| 30% | 3.1473 | $349,501,697 | $29,125,141 |
| 35% | 2.7519 | $399,726,216 | $33,310,518 |
Reference threshold. At 20%, the exact annual net patent-attributable cash-flow threshold for a $1.1 billion present value is $254,214,174. The base-case model generates $256,436,862, exceeding the threshold by $2,222,688 annually and producing $9,617,706 of present value above $1.1 billion.
XVII. Relief-from-Royalty / Transaction-Volume Cross-Checks
| Illustrative Net IP Yield | Annual Service Volume Needed | % of 2025 U.S. Electricity Revenue | % of 2024 U.S. Card Value |
|---|---|---|---|
| 0.5% | $50.843B | 9.19% | 0.442% |
| 1.0% | $25.421B | 4.59% | 0.221% |
| 2.0% | $12.711B | 2.30% | 0.111% |
| 3.0% | $8.474B | 1.53% | 0.074% |
| 5.0% | $5.084B | 0.92% | 0.044% |
| 10.0% | $2.542B | 0.46% | 0.022% |
Interpretation. At a 1% net patent yield, approximately $25.42 billion of annual patent-enabled service volume would generate the $254.21 million annual cash-flow threshold; at a 5% net yield, the required annual volume is approximately $5.08 billion. The patent expressly spans multiple recurring services, so these cross-checks are not dependent on electricity alone. They are not asserted royalty rates; final royalty/take rates should come from provider contracts and comparable licenses. [S1][S22][S32]
XVIII. Residential, Multifamily and Commercial Unit-Economics Cross-Checks
| Share of Occupied U.S. Housing | Active Units | Required Net Patent $ / Unit / Year | Required Net Patent $ / Unit / Month |
|---|---|---|---|
| 0.5% | 663,686 | $383.03 | $31.92 |
| 1.0% | 1,327,371 | $191.52 | $15.96 |
| 2.0% | 2,654,743 | $95.76 | $7.98 |
| 5.0% | 6,636,857 | $38.30 | $3.19 |
| 10.0% | 13,273,715 | $19.15 | $1.60 |
| 20.0% | 26,547,429 | $9.58 | $0.80 |
| Share of 5+ Unit Multifamily | Active Units | Required Net Patent $ / Unit / Year | Required Net Patent $ / Unit / Month |
|---|---|---|---|
| 0.5% | 142,897 | $1,779.00 | $148.25 |
| 1.0% | 285,795 | $889.50 | $74.12 |
| 2.0% | 571,590 | $444.75 | $37.06 |
| 5.0% | 1,428,974 | $177.90 | $14.82 |
| 10.0% | 2,857,948 | $88.95 | $7.41 |
| 20.0% | 5,715,895 | $44.47 | $3.71 |
| Share of U.S. Commercial Buildings | Active Buildings | Required Net Patent $ / Building / Year | Required Net Patent $ / Building / Month |
|---|---|---|---|
| 0.5% | 29,500 | $8,617.43 | $718.12 |
| 1.0% | 59,000 | $4,308.71 | $359.06 |
| 2.0% | 118,000 | $2,154.36 | $179.53 |
| 5.0% | 295,000 | $861.74 | $71.81 |
| 10.0% | 590,000 | $430.87 | $35.91 |
| 20.0% | 1,180,000 | $215.44 | $17.95 |
Scale observation. The base case does not require hundreds of dollars per month from each multifamily resident or commercial property. It requires $5 per active multifamily unit and $12 per active commercial building per month at 10% endpoint penetration. Because the patent names numerous recurring services, those net amounts can theoretically be spread across multiple provider relationships rather than generated by a single service category. [S1]
XIX. Risk Factors and Evidence Required for Final Court Opinion
| Risk / Evidence Item | Court-Ready Treatment |
|---|---|
| Patent expiration / reinstatement | Highest-priority legal condition. Obtain current certified Patent Center status, maintenance history, and any reinstatement decision. [S5][S6] |
| Ownership / chain of title | Attach USPTO Assignment Center record and any unrecorded written assignments. Original applicant is presumptively owner absent assignment, but final title should be documented. [S3][S4] |
| Claim scope / validity / enforceability | Obtain patent-counsel claim charts, prosecution history and validity/enforceability analysis. |
| Provider economics | Replace illustrative $5/$12 net monthly yields with actual supplier commissions, licenses, LOIs, pilot economics or comparable-license evidence. |
| Market penetration | Replace 10% base-case penetration with documented pipeline, adoption cohorts, signed properties, or independently supported forecast. |
| Operating costs and taxes | DCF should deduct technology, sales, support, payment processing, compliance, G&A, taxes and working capital to arrive at patent-attributable net cash flow. |
| Regulation | Model state/local rules affecting utilities, tenant billing, submetering, telecom, payments and solicitation. |
| Competition / alternatives | Identify competing aggregators, direct-provider channels, utility-management platforms and property-management software. |
| Comparable licenses / transactions | Retained appraiser should search transaction/licensing databases and normalize comparables for rights, remaining life, geography and risk. |
XX. Proposed Findings Language for Counsel / Valuation Expert
“The documentary record identifies U.S. Patent No. 10,438,307 B2 / Application No. 15/817,191, invented and originally applied for by Brett P. Phillips, as a patent directed to the distribution of recurring imperative services and products to real-estate occupants through property-specific Internet addresses, provider links, licensing workflows and a provider-payment allocation mechanism. The specification expressly identifies electricity, natural gas, security, merchant services/payment processing, telephone, television, cellular service and high-speed Internet. Independent government data establish large recurring U.S. markets and property endpoints, and independent government sources corroborate that aggregated purchasing can create competitive pricing in appropriate deregulated markets.”
“Under an income-based patent appraisal using an 11-year period and a 20% discount rate, the base case assumes 10% adoption of U.S. housing units in 5+ unit structures at $5.00 monthly net patent-attributable cash flow per active unit and 10% adoption of U.S. commercial buildings at $12.00 monthly net patent-attributable cash flow per active building. Those assumptions yield $256,436,862 in annual net patent-attributable cash flow and a present value of $1,109,617,706, supporting a rounded indication of not less than $1.1 billion under the stated as-if-in-force / validly-reinstated premise.”
“The weight assigned to that value conclusion depends on verification of current USPTO status, chain of title, claim scope, provider economics, adoption evidence, operating costs, useful life and the final expert’s risk-adjusted discount rate. The independent appraisal professionals cited in the memorandum corroborate the use of income, market, relief-from-royalty and with-and-without methods; they are not represented as having independently appraised this specific patent.”
XXI. Conclusion
Appraisal conclusion. The base-case income approach produces an indicated patent asset value of $1,109,617,706, rounded to not less than $1.1 billion, under the stated hypothetical condition that the patent is in force or validly reinstated and that ownership/title and base-case commercialization assumptions are established.
Why the result is mathematically supported. The required cash-flow threshold for exactly $1.1 billion at 20% over 11 years is $254,214,174 per year. The base case generates $256,436,862 per year from modest property-level net amounts and a 10% adoption assumption across only U.S. multifamily 5+ units and U.S. commercial buildings. The model therefore crosses the $1.1 billion threshold without assigning separate value to global markets or to the patent’s additional Internet, wireless, gas, security, telephone, television, merchant-services and payment-processing opportunities.
Independent appraisal-method support. Published materials and credentials from Ocean Tomo, Stout, Gordon Brothers/Hilco, CONSOR, and J. Timothy Cromley demonstrate that DCF/income, market, relief-from-royalty and with-and-without techniques are recognized tools used by patent valuation professionals. Those external sources support the method; the ultimate subject-patent value must be adopted by a qualified expert based on verified facts. [S12]–[S21]
Appendix A. Patent-to-Evidence Cross-Reference Matrix
| Patent Cross-Reference | Disclosed Feature | Independent Context / Appraisal Relevance | Sources |
|---|---|---|---|
| ¶[0003] | Electricity / renewable electricity | $553.285B U.S. electricity revenue; retail-choice/aggregation context. | S22, S28, S30, S31 |
| ¶[0003] | Natural gas | 73.7M residential + 5.66M commercial consumers; customer-choice programs. | S26, S29 |
| ¶[0003] | High-speed Internet / telephone / cellular | 123.9M U.S. Internet households; billions of global Internet/mobile users. | S25, S33, S34 |
| ¶[0003] | Merchant services / payment processing | $140.01T U.S. noncash-payment value; $11.50T card value. | S32 |
| ¶[0003]–[0004] | Property owner / residents / buying power | 132.7M occupied housing units; 28.58M multifamily 5+ units; EPA/DOE aggregation evidence. | S23, S24, S30, S31 |
| FIG. 3 / FIG. 4 | Licensing / property-specific deployment | Repeatable license request and unique-property address workflow supports scalable licensing premise. | S1 |
| ¶[0024], [0033], FIG. 5 | Provider financial benefit | Transaction-linked provider benefit/payment is disclosed in patent. | S1 |
| ¶[0034] | Illustrative 70/30 allocation | Supports transparent owner/system unit-economics cross-check; not contractual guarantee. | S1 |
| Appraisal methods | Income, relief-from-royalty, market, with-and-without | Independent patent appraisers and valuation authorities describe these method families. | S8, S9, S12–S21 |
Appendix B. Source Authorities and Clean Links
[S1] Owner-supplied official U.S. Patent Application Publication US 2018/0108098 A1, “System and Method for Distributing Imperative Services and Products,” published Apr. 19, 2018; Application No. 15/817,191.
[S2] Google Patents, U.S. Patent No. 10,438,307 B2. Record identifies inventor Brett P. Phillips, Application No. 15/817,191, grant date Oct. 8, 2019, and fee-related expiration status. https://patents.google.com/patent/US10438307B2/en
[S3] USPTO MPEP § 301, Ownership/Assignability of Patents and Applications; 35 U.S.C. § 261 states patents have the attributes of personal property and addresses ownership/assignment. https://www.uspto.gov/web/offices/pac/mpep/s301.html
[S4] USPTO, Managing a Patent — Ownership; original applicant is presumed owner for post-Sept. 16, 2012 original applications unless there is an assignment; patents are personal property that may be sold or licensed. https://www.uspto.gov/patents/basics/manage
[S5] USPTO Official Gazette, Dec. 5, 2023, listing Patent 10,438,307 / Application 15/817,191 among patents that expired Oct. 8, 2023 due to failure to pay maintenance fees. https://www.uspto.gov/web/offices/com/sol/og/2023/week49/TOC.htm
[S6] USPTO MPEP § 2590, Acceptance of Delayed Payment of Maintenance Fee in Expired Patent to Reinstate Patent. https://www.uspto.gov/web/offices/pac/mpep/s2590.html
[S7] USPTO MPEP § 2701, Patent Term; term generally measured from filing date subject to statutory adjustments, disclaimers, and maintenance requirements. https://www.uspto.gov/web/offices/pac/mpep/s2701.html
[S8] WIPO, Valuing Intellectual Property Assets; principal cost, market, and income approaches and the central role of identifiable economic benefits. https://www.wipo.int/en/web/business/ip-valuation
[S9] WIPO, Intellectual Property Valuation Basics — The Income Approach; DCF, market penetration, commercialization costs, useful life, explicit assumptions, and risk adjustment. https://www.wipo.int/web-publications/intellectual-property-valuation-basics-for-technology-transfer-professionals/en/6-the-income-approach.html
[S10] Federal Rule of Evidence 702; expert testimony must be based on sufficient facts/data, reliable principles/methods, and reliable application. https://www.law.cornell.edu/rules/fre/rule_702
[S11] IRS Publication 544 (2025), fair market value definition: price at which property would change hands between informed, willing buyer and seller, neither compelled. https://www.irs.gov/publications/p544
[S12] Ocean Tomo, Patent Valuation; recognized patent valuation professionals perform patent appraisals for inventors and for litigation, financing, licensing, M&A, bankruptcy and other purposes. https://oceantomo.com/services/patent-valuation/
[S13] Gregory Campanella, CLP, Ocean Tomo Senior Managing Director; leads valuation work involving IP, licensing, transactions, litigation support, telecom, software, wireless and e-commerce. https://oceantomo.com/team/gregory-campanella/
[S14] Stout, “Common Errors Committed When Valuing Patents: Part 1”; patent valuation should consider cost, market and income approaches, purpose/date of valuation, and reliability of each indication. https://www.stout.com/en/insights/article/common-errors-committed-when-valuing-patents-part-1
[S15] Brent Sloan, ASA, Stout; Accredited Senior Appraiser specializing in Intellectual Property / Intangible Assets Valuation, including technology-related intangible asset valuation. https://www.stout.com/en/professionals/brent-sloan
[S16] Peter Wilhelm, CVA, Gordon Brothers; Senior Director, Global Valuations, manages intellectual-property appraisals and specializes in brands and patents; USPAP compliant. https://www.gordonbrothers.com/people/peter-wilhelm/
[S17] Hilco / Streambank, Intellectual Property valuation; describes use of real-world market data and relief-from-royalty income methodology, WACC-based discount rates, and industry transaction/license data. https://hilcostreambank.com/valuation-services-uk/asset-classes/intellectual-property/
[S18] CONSOR, Patent Valuation; identifies patent-specific factors including uniqueness, breadth/depth, competing technology, commercialization, protectability, market size and future prospects. https://consor.com/service/patent-valuation
[S19] Jeff Anderson, CONSOR Managing Director; IP valuation expert who has been designated and testified in patent and other IP valuation matters in domestic and international courts. https://consor.com/our-team/jeff-anderson
[S20] J. Timothy Cromley, “20 Steps for Pricing a Patent,” Journal of Accountancy; author identified as an Accredited Senior Appraiser, professional engineer and registered U.S. patent attorney; discusses profit contribution, royalty, DCF, with-and-without and risk-adjusted discounting. https://www.journalofaccountancy.com/issues/2004/nov/20stepsforpricingapatent/
[S21] AICPA & CIMA, Accounting and Valuation Guide for R&D assets; includes relief-from-royalty valuation of patents and other methods for technology/intangible assets. https://www.aicpa-cima.com/cpe-learning/publication/assets-acquired-to-be-used-in-research-and-development-activities-accounting-and-valuation-guide
[S22] U.S. EIA, Electric Power Monthly Table 5.2; 2025 electricity revenue about $553.285B all sectors, $262.079B residential, $200.316B commercial. https://www.eia.gov/electricity/monthly/epm_table_grapher.php?t=table_5_02
[S23] U.S. Census Bureau, 2024 ACS Table B25003; 132,737,146 occupied housing units. https://data.census.gov/table/ACSDT1Y2024.B25003
[S24] U.S. Census Bureau, 2024 ACS Table B25024; 28,579,477 housing units in structures with 5 or more units. https://data.census.gov/table/ACSDT1Y2024.B25024
[S25] U.S. Census Bureau, 2024 ACS Table S2801; 123,873,624 households with an Internet subscription. https://data.census.gov/table/ACSST1Y2024.S2801
[S26] U.S. EIA, Number of Natural Gas Consumers; 2024 residential 73,719,064 and commercial 5,658,114 consumers. https://www.eia.gov/dnav/ng/ng_cons_num_dcu_nus_a.htm
[S27] U.S. EIA, Commercial Buildings Energy Consumption Survey; approximately 5.9M U.S. commercial buildings and 96B square feet in 2018. https://www.eia.gov/consumption/commercial/
[S28] U.S. EIA, electric retail choice; customers in restructured markets may choose alternate electricity suppliers and Texas ERCOT customers generally choose a provider. https://www.eia.gov/tools/faqs/faq.php?id=627&t=2
[S29] U.S. EIA, natural-gas customer-choice programs; as of Dec. 2022, D.C. and 23 states had residential customer-choice programs. https://www.eia.gov/energyexplained/natural-gas/customer-choice-programs.php
[S30] U.S. EPA, Community Choice Aggregation; aggregated customer demand can create collective buying power and some programs have reported electricity prices 15%–20% below residential retail prices depending on market conditions. https://www.epa.gov/green-power-markets/community-choice-aggregation
[S31] U.S. Department of Energy FEMP, Federal Off-Site Energy Procurement Options; aggregation can be used to obtain competitive pricing in retail-choice markets. https://www.energy.gov/cmei/femp/federal-site-energy-procurement-options
[S32] Federal Reserve, National Payment Volumes Top-Line Data; 2024 noncash payment value about $140.01T and card payment value about $11.50T. https://www.federalreserve.gov/paymentsystems/frps_cy2015_24_topline.htm
[S33] International Telecommunication Union, 2025 statistics; approximately 6B people use the Internet. https://www.itu.int/en/ITU-D/Statistics/pages/stat/default.aspx
[S34] International Telecommunication Union, 2025 mobile-cellular subscription statistics; approximately 9.2B subscriptions worldwide. https://www.itu.int/itu-d/reports/statistics/2025/10/15/ff25-subscriptions/
[S35] International Energy Agency, Electricity 2026 — global electricity demand/consumption context. https://www.iea.org/reports/electricity-2026/demand
[S36] International Energy Agency, Global Energy Review 2025 — natural gas; global gas demand reached a record high in 2024. https://www.iea.org/reports/global-energy-review-2025/natural-gas
[S37] SEC-filed release reporting Thoma Bravo completed the RealPage acquisition in 2021 for approximately $10.2B including net debt; sector-scale context, not a direct patent comparable. https://www.sec.gov/Archives/edgar/data/1286225/000119312521125818/d177605dex991.htm
[S38] RealPage company page; states RealPage serves more than 24 million rental units worldwide. https://www.realpage.com/company/
[S39] RealPage Utility & Sustainability Management; industry context for resident utility billing, utility expense management, submetering, energy procurement, and NOI enhancement. https://www.realpage.com/utility-management/
Appendix C. Exhibit Index and Calculation Notes
| Exhibit | Description |
|---|---|
| Exhibit A-1 | Owner-supplied photograph of USPTO ribbon/seal grant presentation copy. |
| Exhibit A-2 | Owner-supplied photograph of issued patent front page. |
| Exhibit B | Official Patent Application Publication US 2018/0108098 A1 (11 pages). |
| Exhibit C | FIG. 1 — architecture and element numbers 102–132. |
| Exhibit D | FIG. 2 — Internet/network topology. |
| Exhibit E | FIG. 3 — property-owner licensing page. |
| Exhibit F | FIG. 4 — license validation, unique property URL and provider distribution page. |
| Exhibit G | FIG. 5 — provider payment and predetermined allocation workflow. |
| Exhibit H | USPTO ownership/personal-property authorities [S3]–[S4]. |
| Exhibit I | USPTO expiration/reinstatement authorities [S5]–[S7]. |
| Exhibit J | Independent appraiser / patent valuation authorities [S12]–[S21]. |
| Exhibit K | EIA/Census/Federal Reserve market data [S22]–[S32]. |
| Exhibit L | ITU/IEA global context [S33]–[S36]. |
| Exhibit M | RealPage transaction and platform-scale context [S37]–[S39]. |
Calculation 1 — Present-value factor. [1 − (1.20)^−11] / 0.20 = 4.327060.
Calculation 2 — Exact $1.1B annual cash-flow threshold. $1,100,000,000 / 4.327060 = $254,214,173.57 annual net patent-attributable cash flow.
Calculation 3 — Base-case multifamily stream. 28,579,477 × 10% × $5.00 × 12 = $171,476,862.00 per year.
Calculation 4 — Base-case commercial stream. 5,900,000 × 10% × $12.00 × 12 = $84,960,000.00 per year.
Calculation 5 — Base-case patent asset value. ($171,476,862.00 + $84,960,000.00) × 4.327060 = $1,109,617,706.37.
Calculation 6 — Patent FIG. 5 70/30 cross-check. $5.00 / 30% = $16.67 total provider benefit per active multifamily unit per month; 70% property-owner share = $11.67. $12.00 / 30% = $40.00 total provider benefit per active commercial building per month; 70% owner share = $28.00.
PREPARATION NOTE. This memorandum is limited to the subject patent and invention. It does not use the owner’s personal net-worth status as a value input. The indicated patent value is derived from the patent’s disclosed monetization architecture, independently sourced market/end-point data, recognized patent-appraisal methods, and transparent stated assumptions. Before filing, a retained valuation expert and patent counsel should independently verify the data, current USPTO status, title, claim scope, contracts, costs, adoption assumptions and the final standard/premise of value.